Power BI Copilot vs. Claude (MCP + Project)
Two ways to let non-technical people ask questions of your company's data. This lays out the trade-off honestly — where each is stronger, what each costs, and what would still need building.
Copilot bij Power BI & Claude die het zelf maakt
Twee manieren op jullie eigen data — met per optie de flow, de sterke punten en een eerlijk advies.
Copilot als co-piloot voor PowerBI reports
Power BI levert de officiële dashboards; Copilot bouwt binnen Power BI mee en versnelt het werk.
Voor officiële cijfers, vaste visualisaties, toegang en besluitvorming ga je altijd terug naar Power BI. De winst zit in sneller en beter bouwen met Copilot erop.
Claude genereert coole reports (artifacts)
Claude bouwt het dashboard rechtstreeks als artifact, zonder Power BI ertussen.
Sterk voor exploratie en draagvlak. Voor officiële, altijd-actuele cijfers schakel je naar Power BI (oplossing 1) — na de pre-POC kiezen we waar we op doorbouwen.
The cost picture
Rough monthly figures at proof-of-concept scale — the shapes differ more than the numbers.
Fixed Fabric capacity tier (F2), scaling in steps (F64, F128…) as usage grows. Shared across all Fabric workloads.
Usage-based seat cost plus modest hosting at POC scale. Scales with query frequency more than raw data size.
Power BI needs a semantic model built first
Before Copilot can answer a single question, someone has to build a semantic model: importing each table, defining the relationships between them, and authoring the measures (revenue, margin, and so on) that Copilot then reads from. The model below — Customer, SalesPlan, SalesInvoiceLines, SalesInvoiceHeader and Employee, wired together by their surrogate keys — is exactly that upfront work, and it has to exist and stay maintained before any reporting begins.
Claude takes the other path: it queries the mirrored tables directly, so there is no modeling step to complete first — the trade-off being that the modeled layer is also what gives Power BI its caching, per-row security and fast repeat queries.
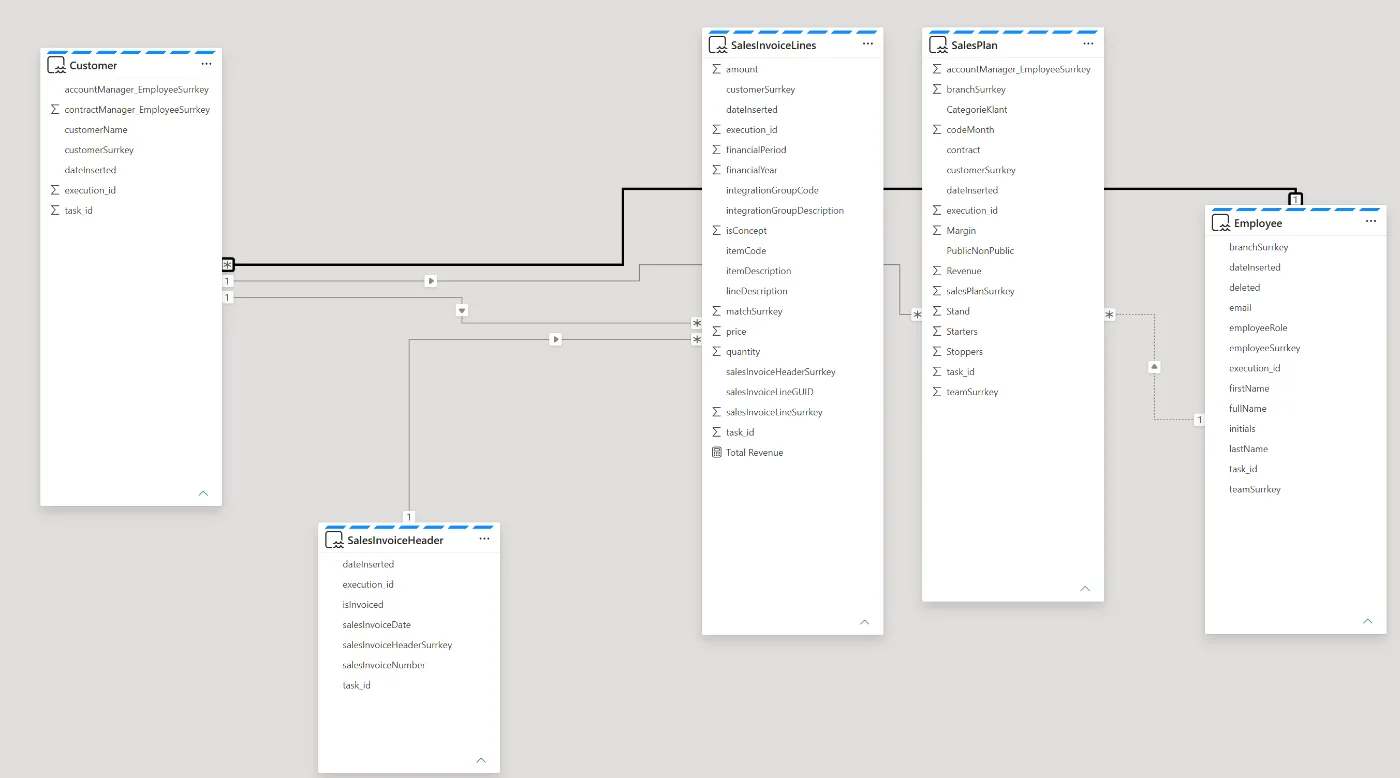
The semantic model in Power BI — tables and relationships that must be defined before Copilot can report on them.